Medical App - Zika Track
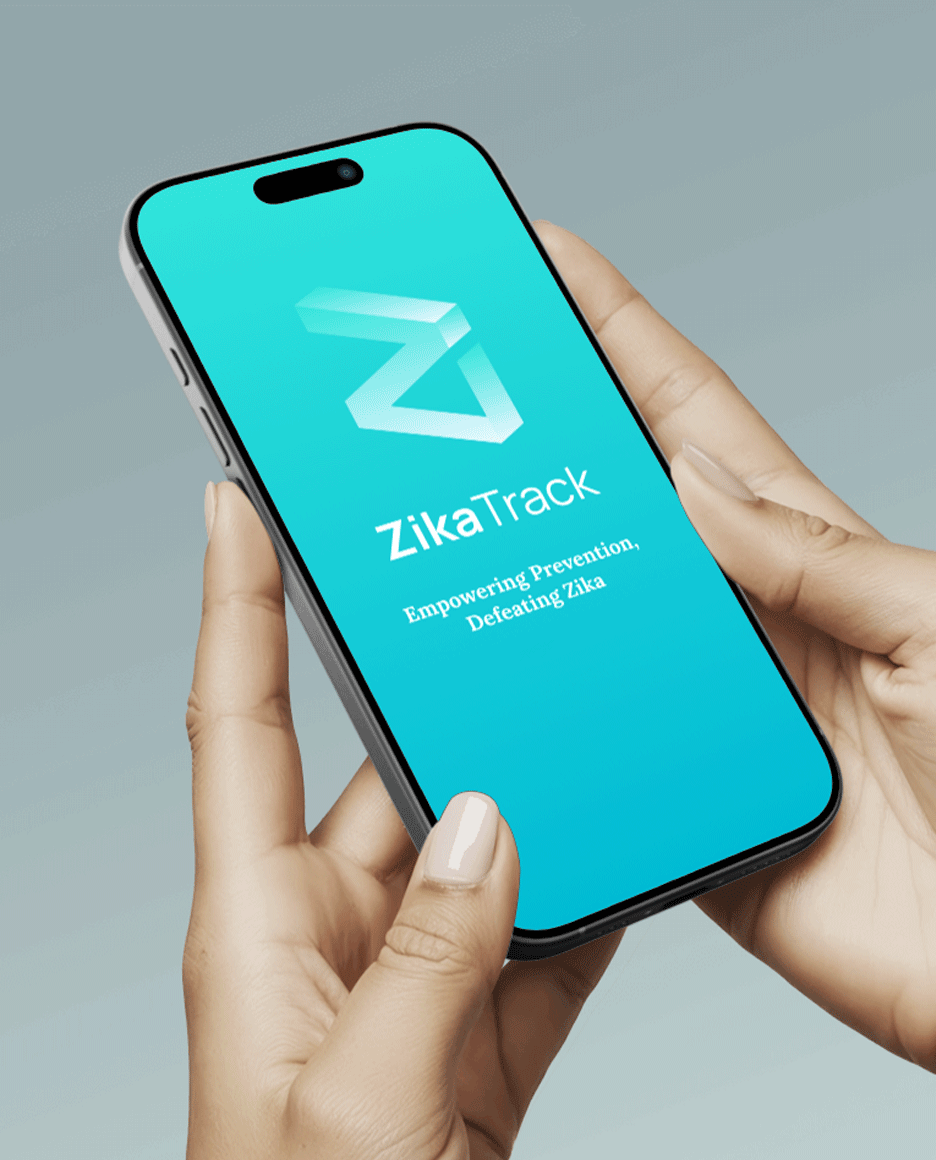

ZikaTrack App
Empowering communities through accessible health information and data contribution
Project Overview
Duration: 3 Months
Role: UX/UI Designer & Researcher
Type: Health Tech
Tools: Figma, Survey Tools, User Testing
The Challenge
During Zika virus outbreaks, individuals struggle to access accurate, real-time information and lack platforms to contribute to community health surveillance efforts. Existing health apps don't provide specialized Zika prevention guidance or community-driven monitoring features.
The Solution
ZikaTrack is a comprehensive mobile app that provides real-time Zika virus information, prevention guidance, and unique photo analysis features that enable users to contribute to mosquito surveillance efforts.
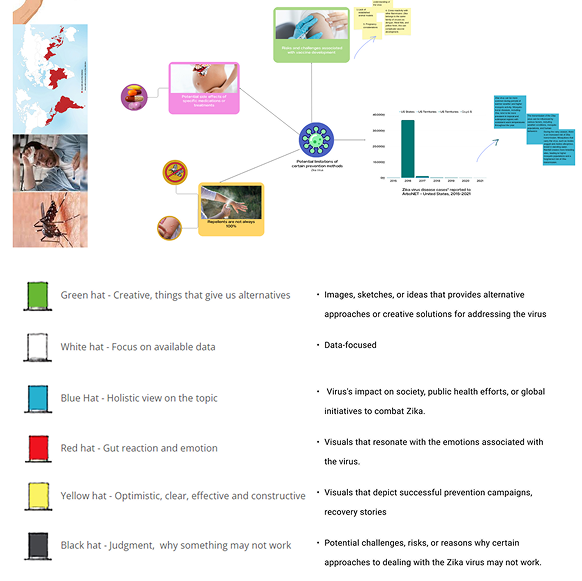
Research & Discovery
Understanding the Problem
"If I had an hour to solve a problem, I'd spend 55 minutes thinking about the problem and 5 minutes thinking about solutions." - Einstein
Problem Statement
How might we develop a mobile application that effectively addresses the challenges individuals face in accessing accurate and up-to-date information, implementing preventive measures, and staying informed about zika virus thereby mitigating the spread of the virus and promoting public health?
Medical Research Findings:
- Zika virus transmitted primarily through Aedes mosquitoes
- 80% of infected individuals are asymptomatic
- Severe complications include microcephaly in infants
- Prevention relies heavily on mosquito control and public awareness
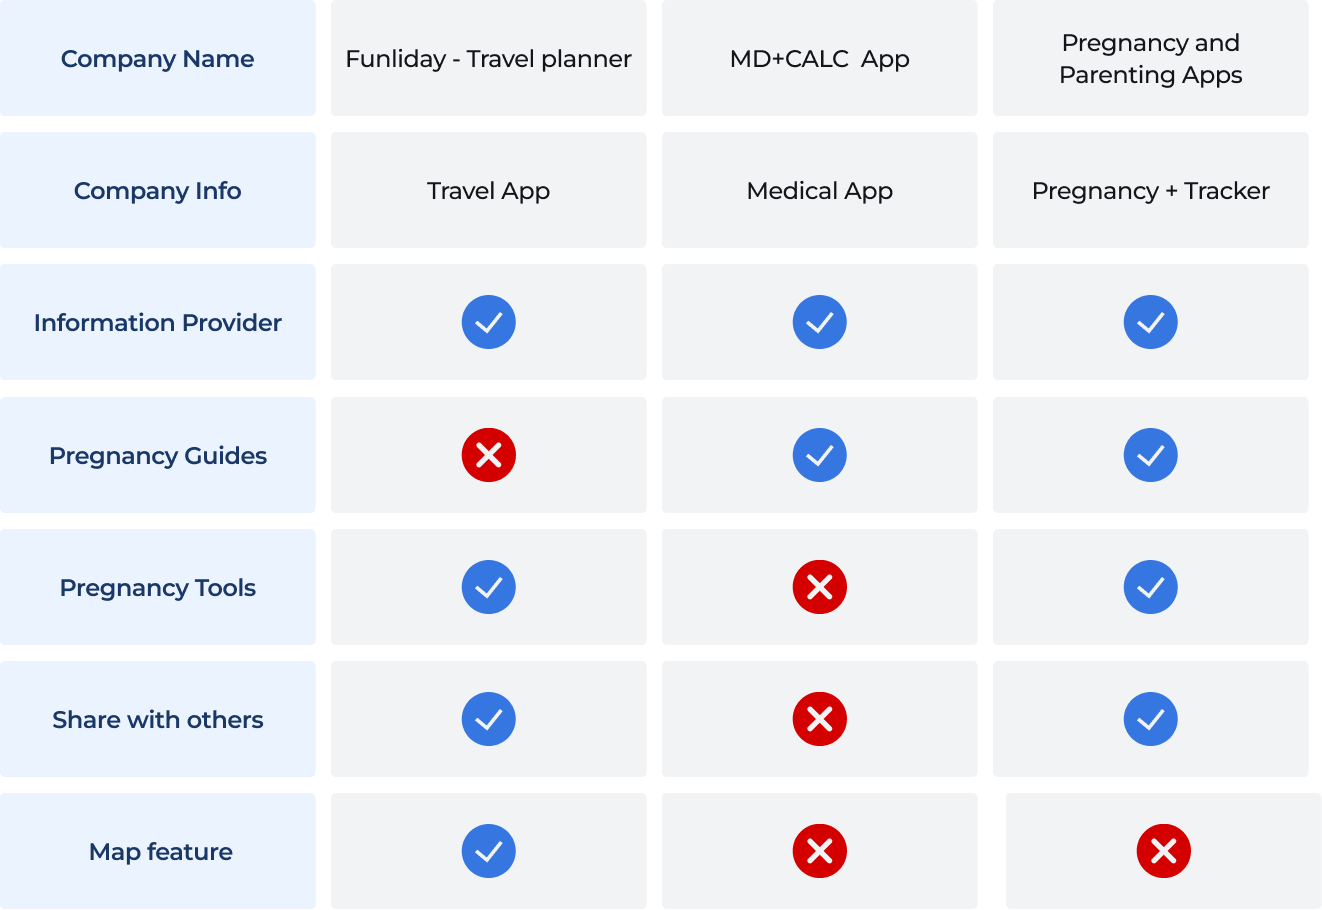
Competitive Analysis
Analyzed three categories of apps:
- Funliday (Travel App): Map features, information sharing
- MD+CALC (Medical App): Clinical calculations, medical data
- Pregnancy Tracker Apps: Health monitoring, educational content
Gap Identified: No existing app combined real-time Zika tracking with community-driven photo analysis for mosquito surveillance.
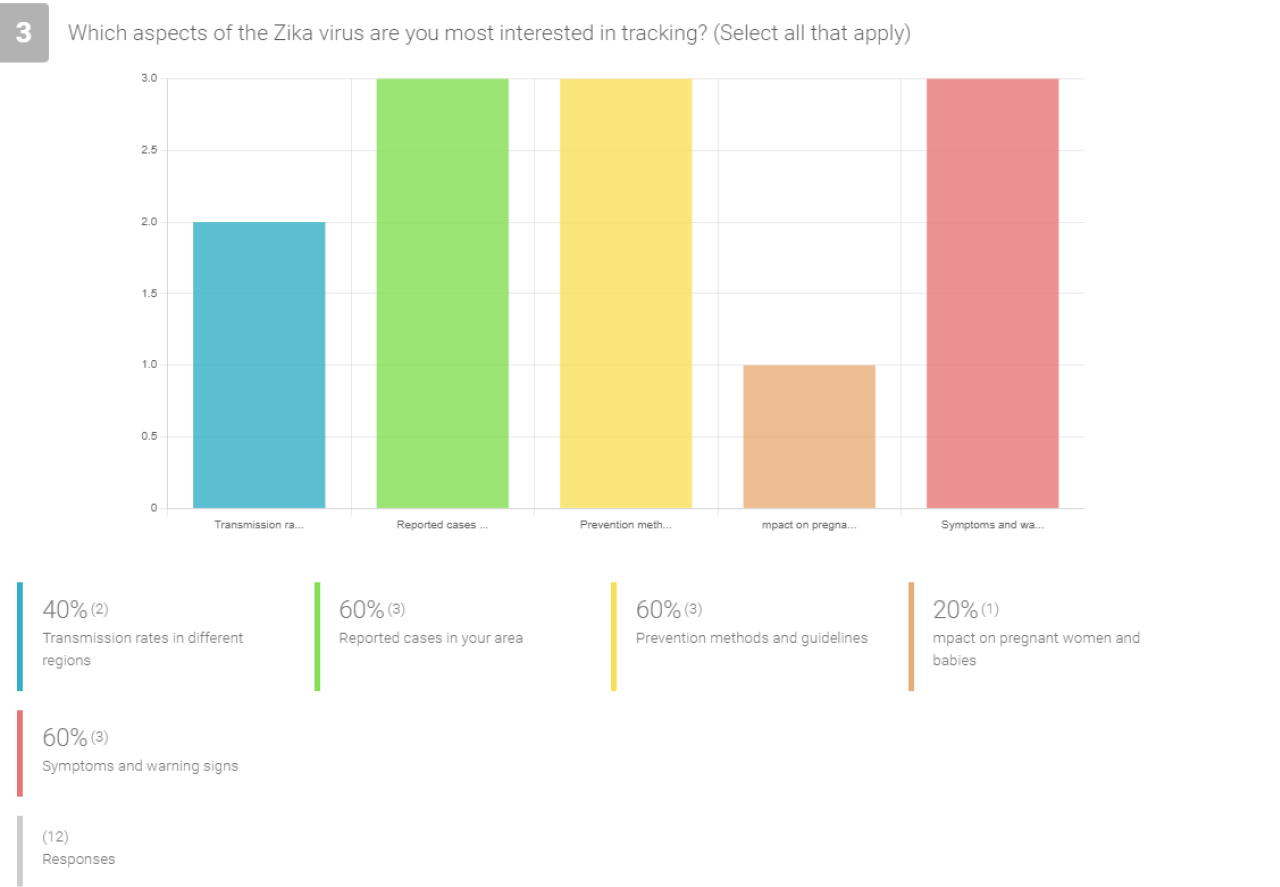
Quantitative Research Insights
Survey Results (n=10):
- 40% seek Zika information weekly
- 80% consider real-time updates very important
- 80% rely on internet/websites as primary information source
- 80% expressed neutral satisfaction with current sources
- 95% wanted articles and regular notifications
- 97% willing to share anonymous location/health data
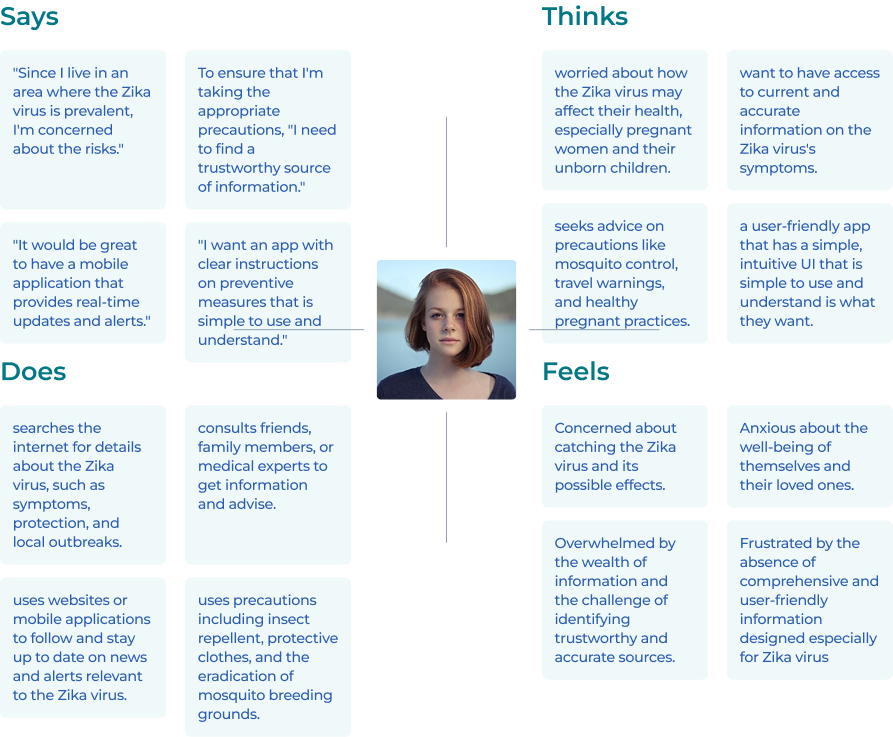
User Research
Empathy Mapping
Key User Concerns:
- Says: "I need trustworthy information sources" / "I live in a Zika-prevalent area"
- Thinks: Worried about health impacts, especially pregnant women
- Does: Searches online, consults medical experts, uses protective measures
- Feels: Concerned, anxious, overwhelmed by information overload
Pain Points Identified
- Language/Cultural Barriers: Difficulty understanding prevention information
- Lack of Personalization: Generic content not addressing specific situations
- Communication Gaps: No reliable channels for questions and concerns
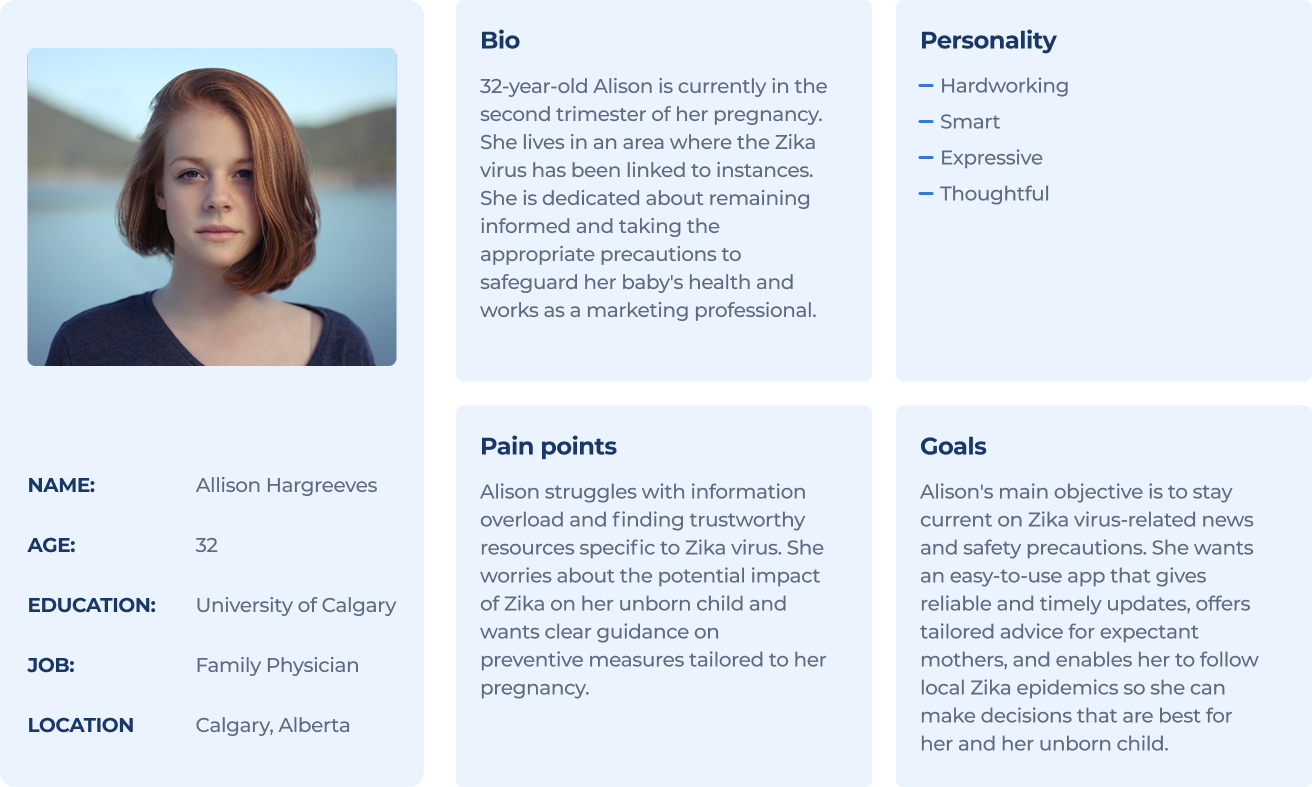
Primary Persona: Alison Hargreeves
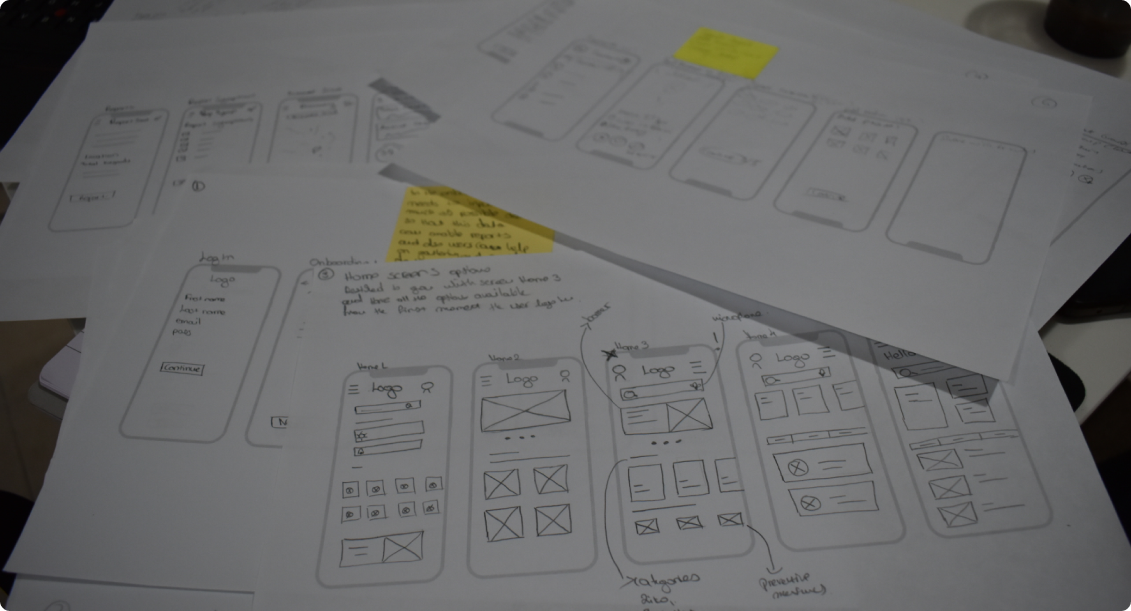
Design Process
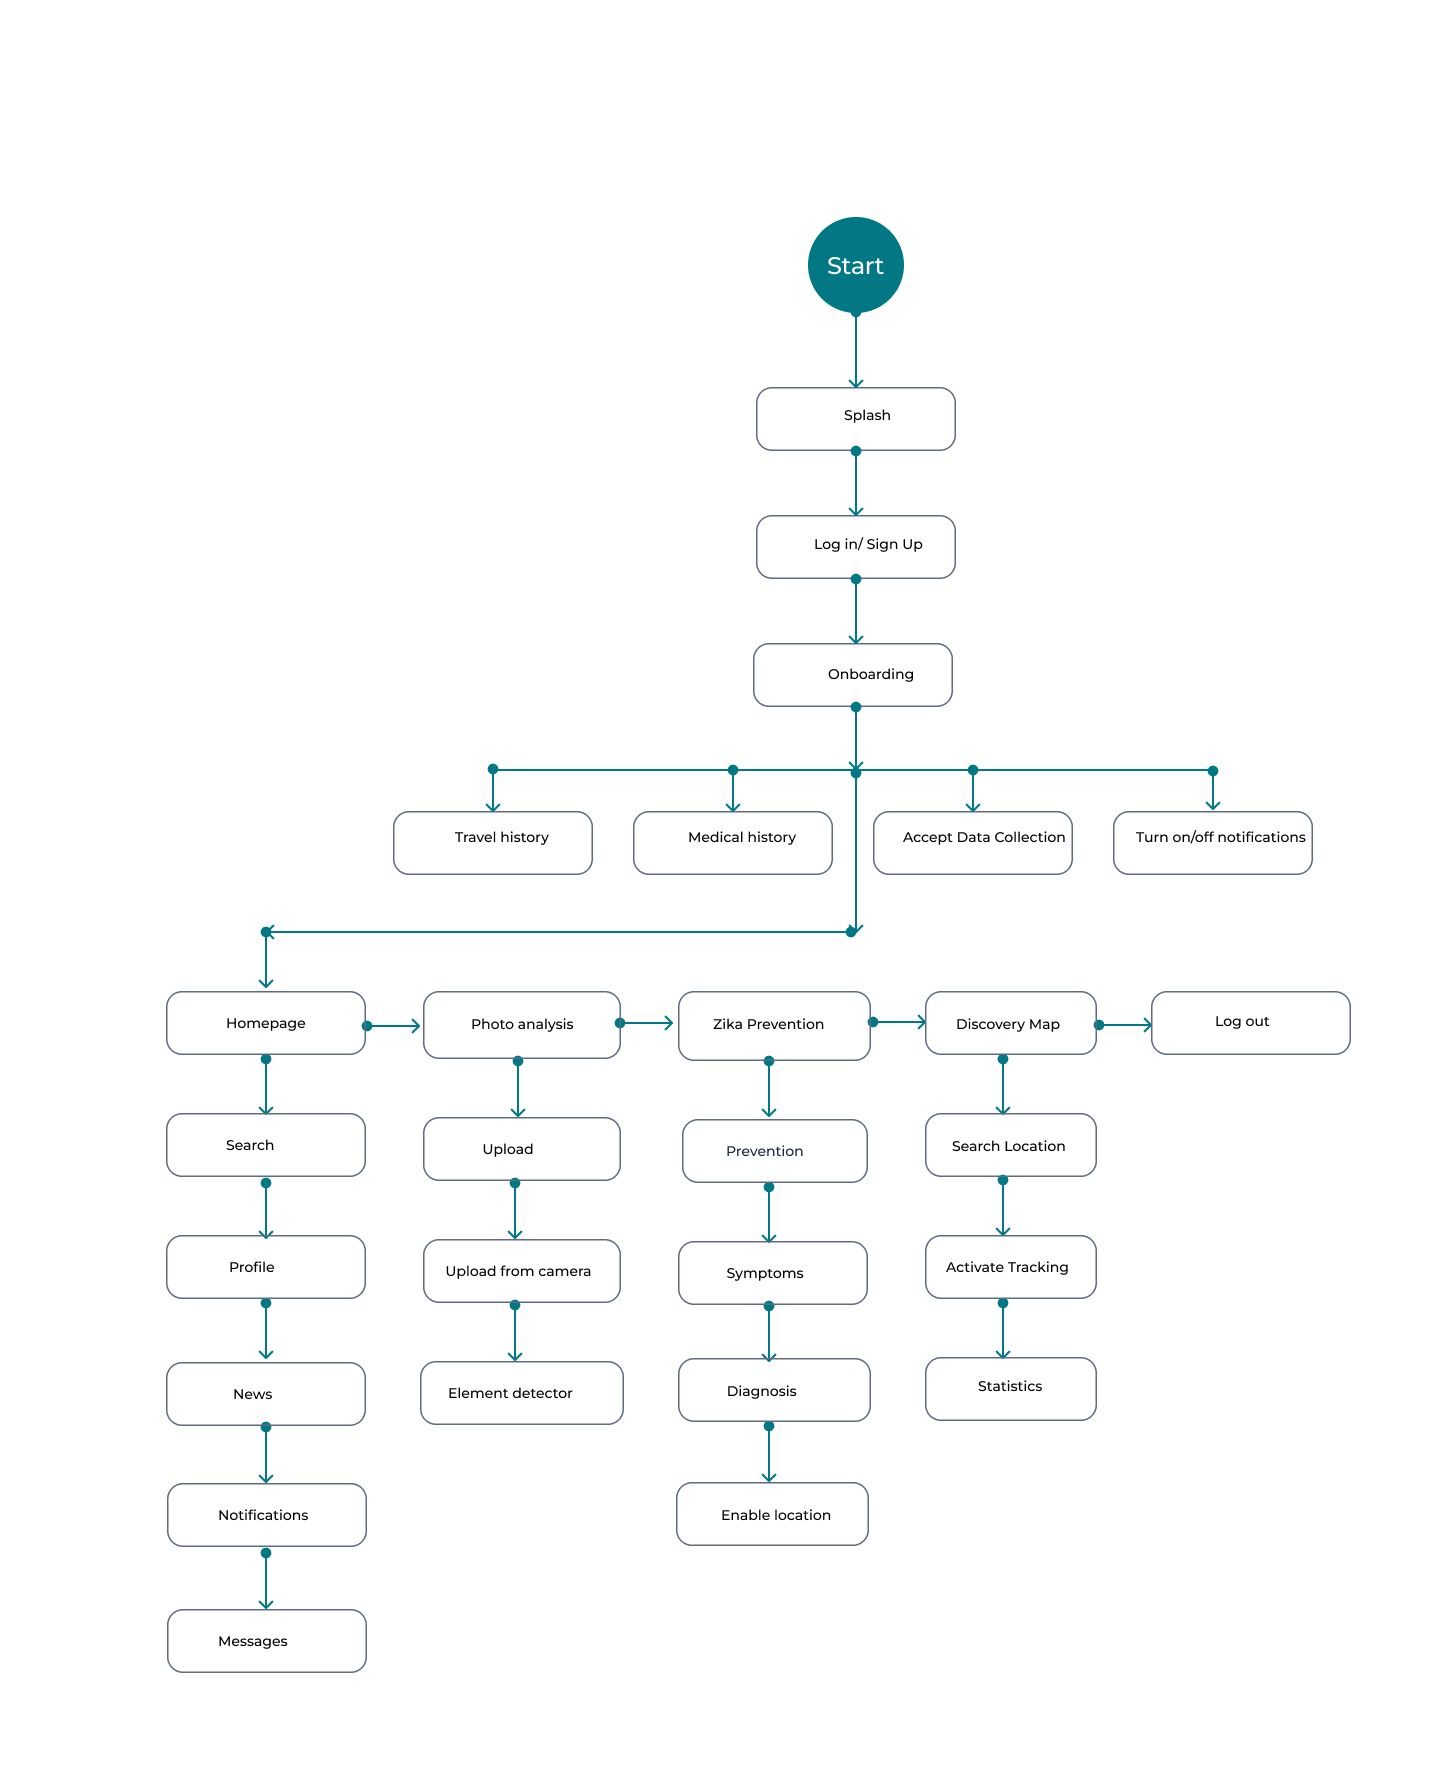
Information Architecture & User Flow
Created comprehensive user journey mapping from onboarding through key features:
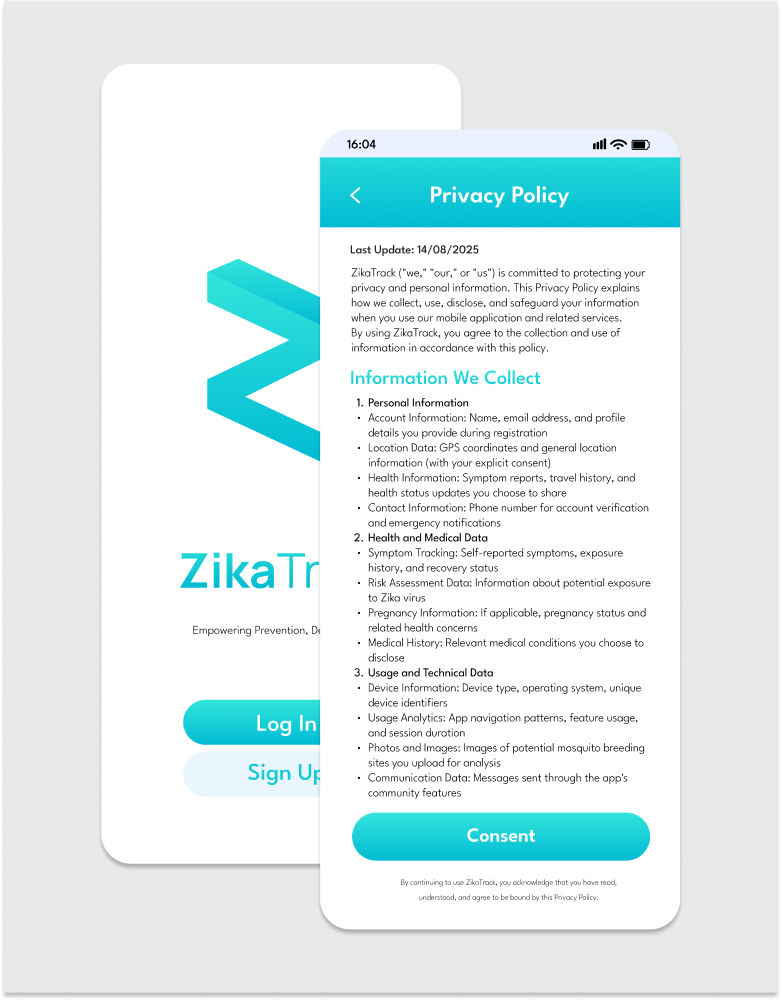
- Onboarding with privacy controls
- Information browsing and categorization
- Photo analysis workflow
- Community interaction features
Unique Features Developed
- Photo Analysis: Users upload images of potential mosquito breeding sites
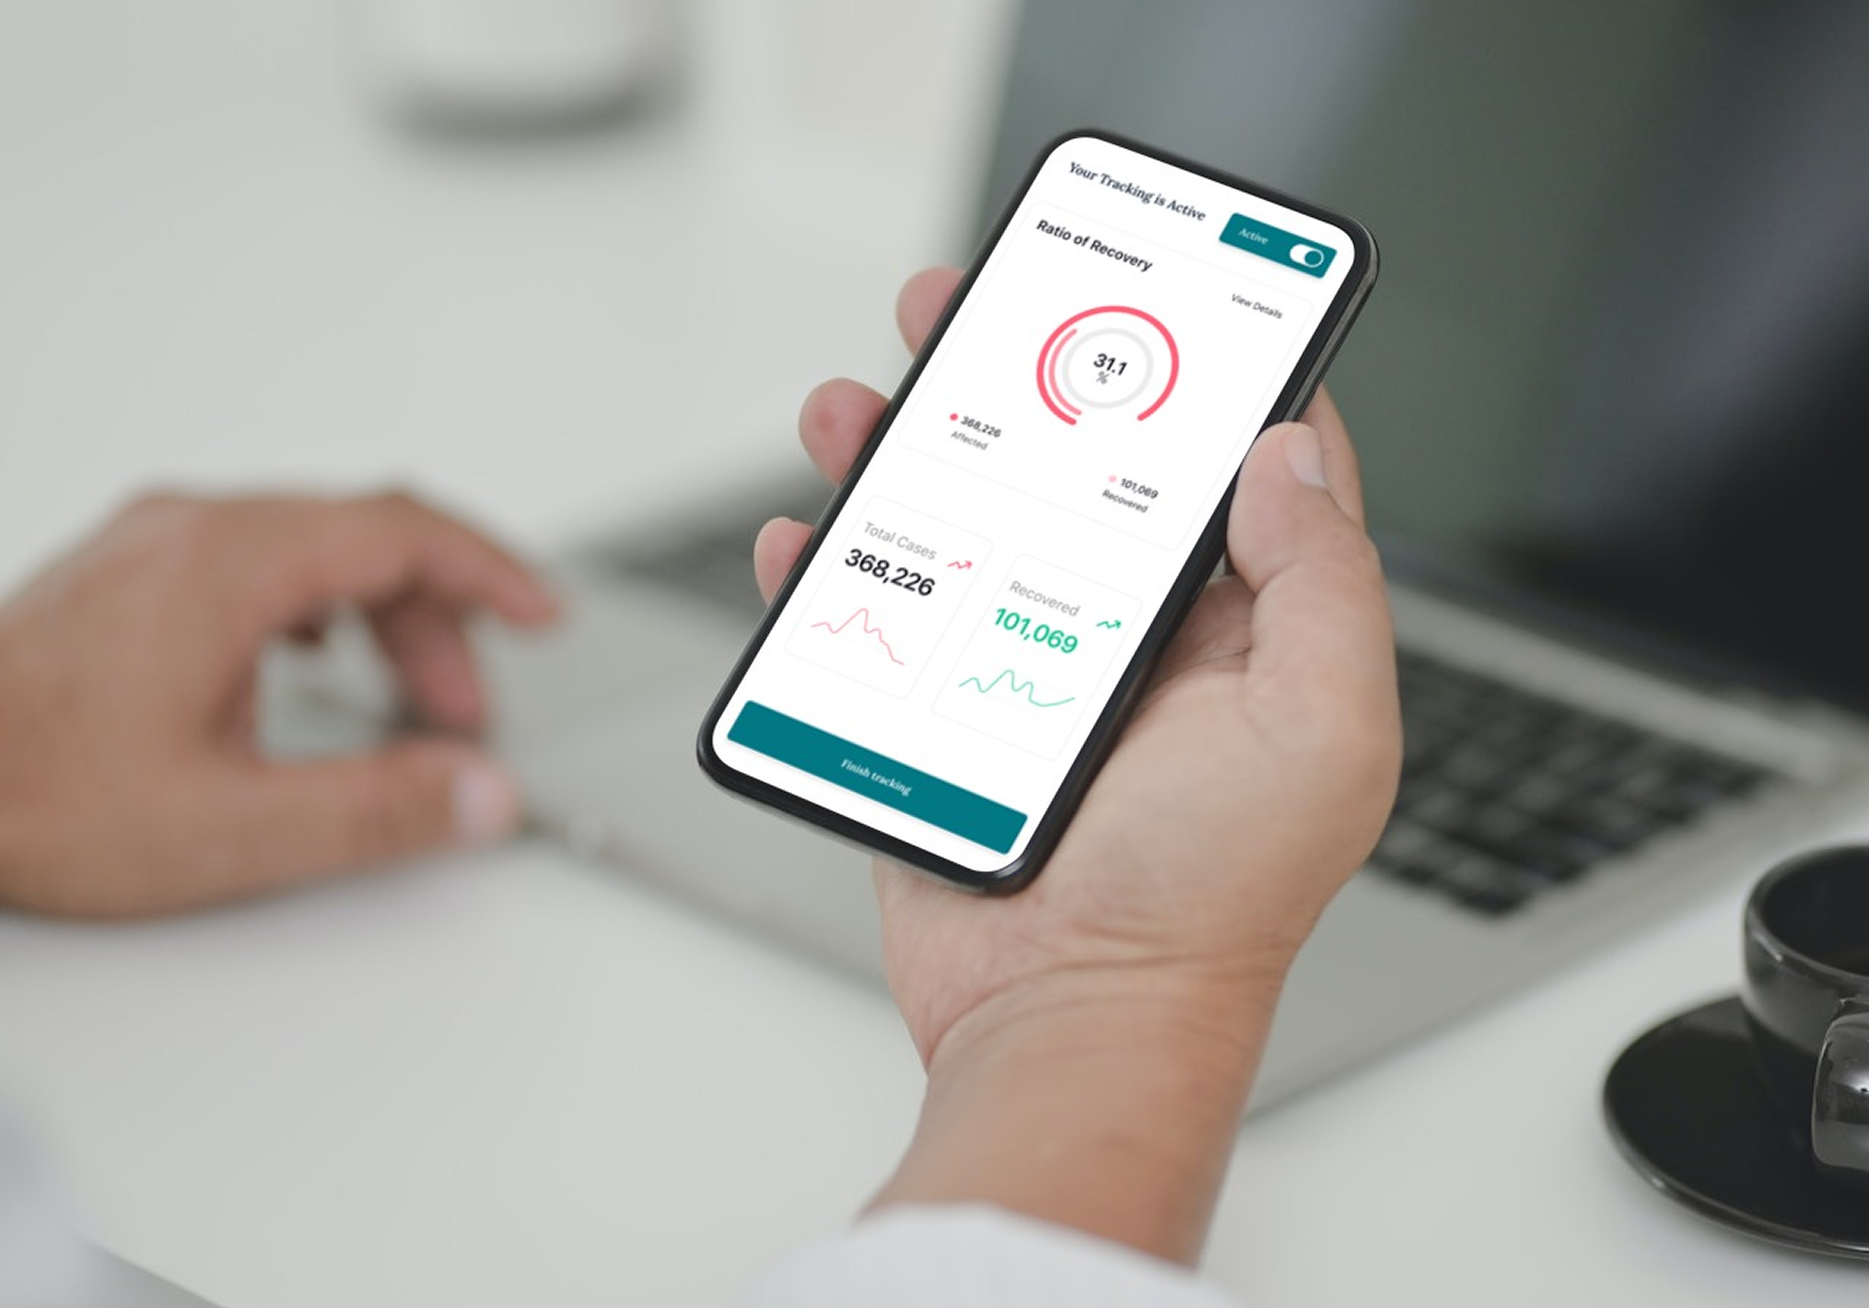
- Real-time Statistics: Live outbreak data and reports
- Interactive Community: User-to-user communication and experience sharing
- Prevention Techniques: Comprehensive mosquito control guidance
Design Solutions
Low-Fidelity to High-Fidelity Evolution
Key Design Iterations:
- Homepage Redesign: Changed from photo carousel to clear action button after usability testing
- Color System Update: Removed red from categories to avoid confusion with alerts
- Onboarding Enhancement: Added skip buttons for sensitive data collection
Visual Design System
Typography Hierarchy: 6-level system (48px to 16px)Color Strategy: Calming blues and greens to reduce health anxietyAccessibility: WCAG compliance for users with disabilities
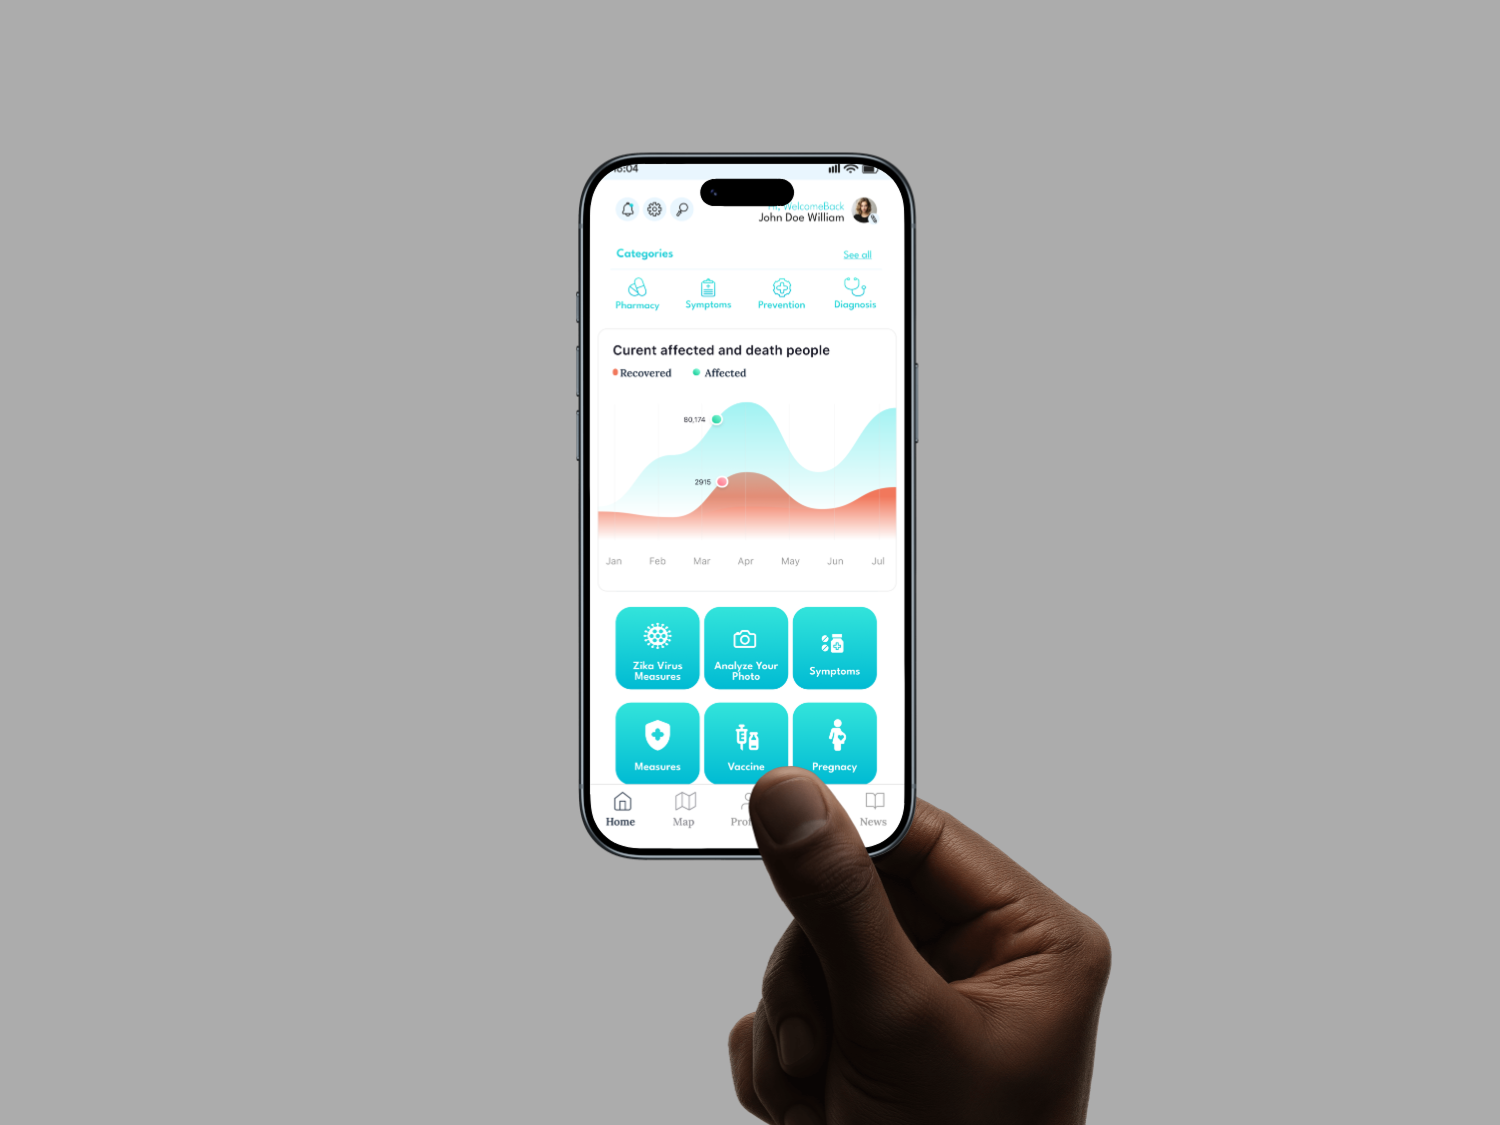
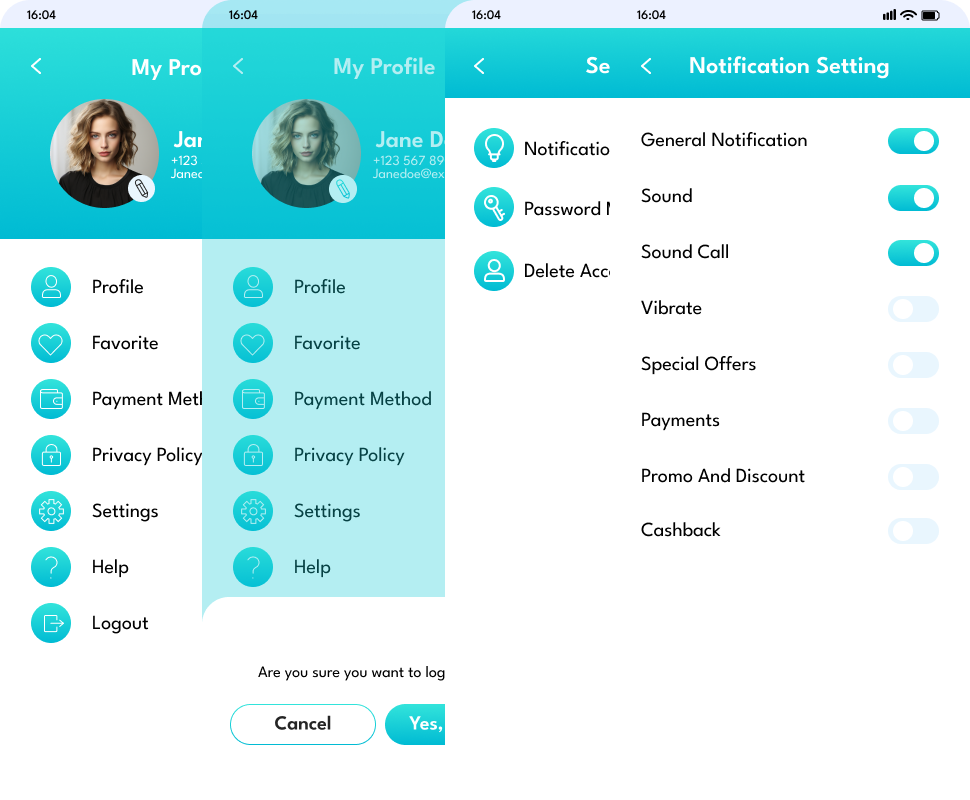
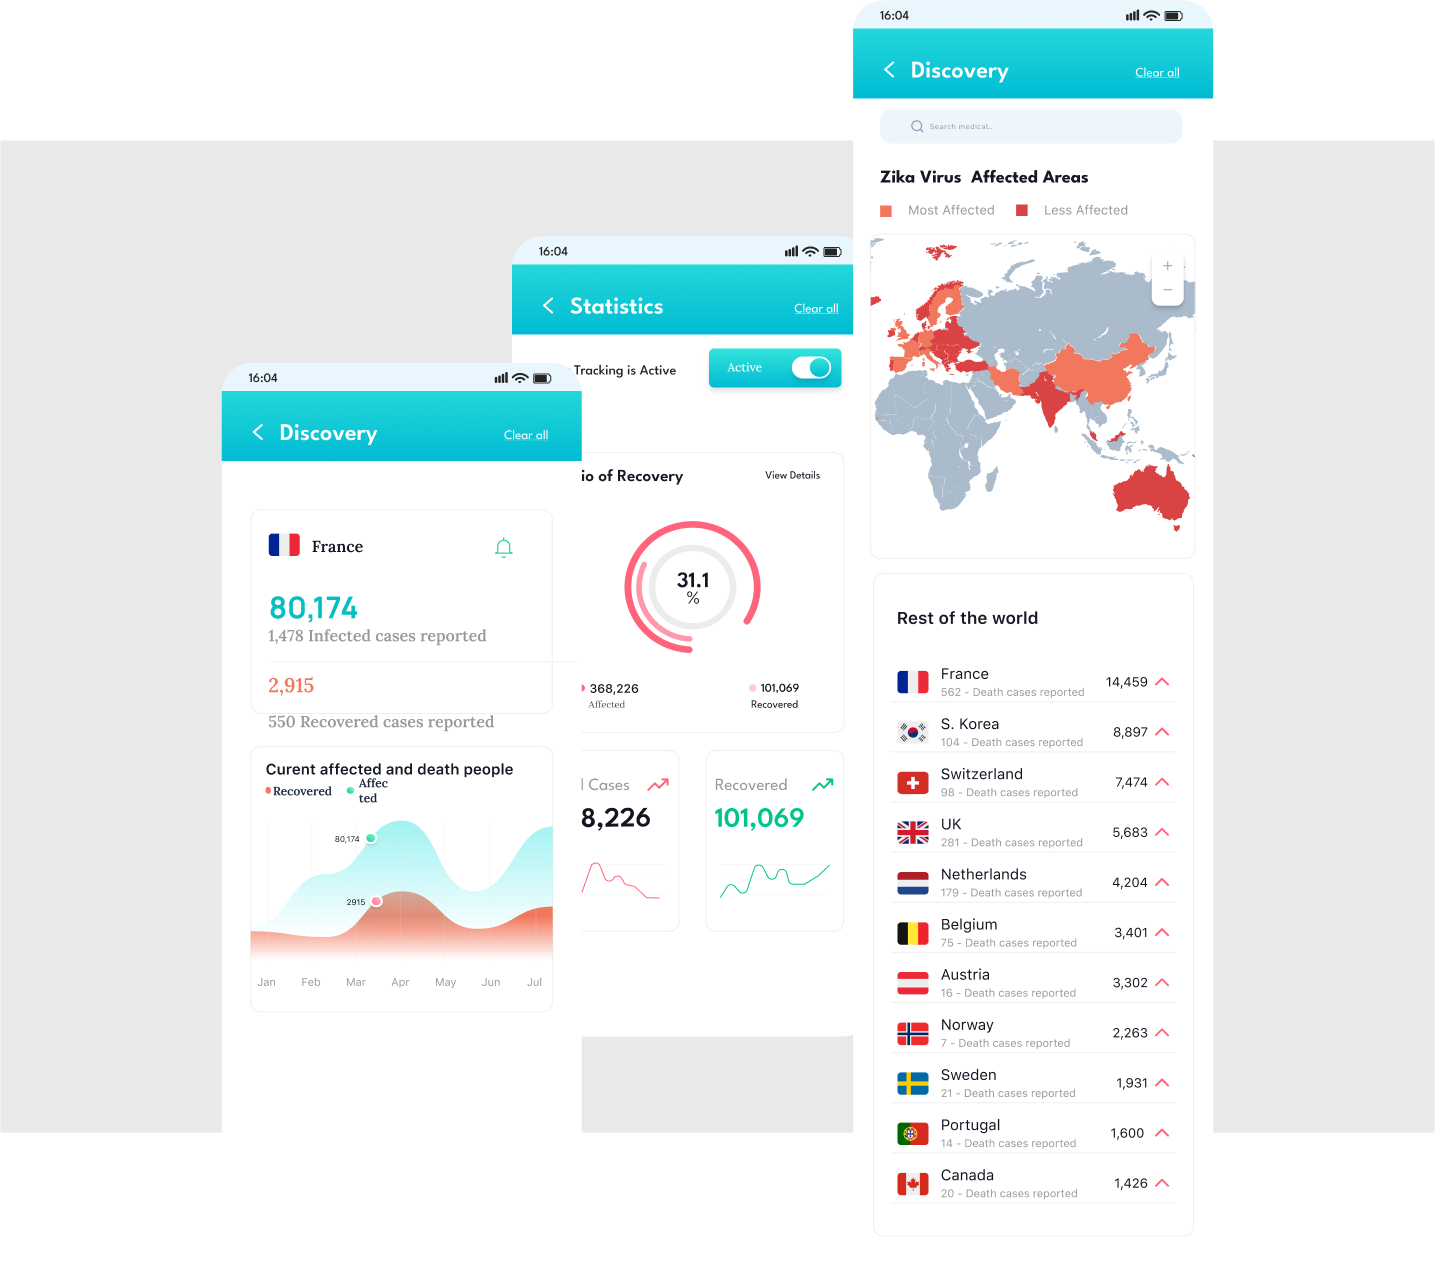
Key Screens
- Onboarding: Optional notifications and location permissions
- Home Dashboard: Quick access to prevention, analysis, and statistics
- Photo Analysis: Camera/gallery integration with AI-powered assessment
- Community Features: Messaging and information sharing
- Prevention Guide: Categorized safety measures and tips


Testing & Validation
Usability Study Findings
Critical Discovery: Users initially hesitant about sharing medical data
Solution Implemented: Added comprehensive data usage explanation and consent process
View the Interactive Prototype Demo in Figma
Key Changes Made:
- Added skip buttons throughout onboarding
- Improved photo analysis button visibility
- Enhanced data collection transparency
- Clarified research contribution value
User Feedback Integration
Users became more willing to share data when understanding its contribution to virus research and vaccine development efforts.
Impact & Results
Achieved Objectives
- Information Accessibility: Simplified complex medical information
- Community Engagement: Created platform for shared experiences
- Research Contribution: Enabled user-driven data collection
- Prevention Education: Comprehensive, actionable guidance
Technical Implementation
- Responsive Design: Mobile-first approach with web companion
- Real-time Data: Integration with health organization APIs
- Privacy-First: Anonymous data collection with user consent
- Accessibility: Screen reader compatibility and high contrast options
Challenges & Learnings
Key Challenges
- Privacy Concerns: Balancing data collection needs with user privacy
- Medical Accuracy: Ensuring all health information was clinically sound
- User Trust: Building confidence in health data sharing
Design Insights
- Trust Through Transparency: Users more likely to share data when purpose is clear
- Iterative Testing Critical: Early usability testing revealed major navigation issues
- Community Value: Users appreciated connecting with others facing similar concerns
- Education vs. Alarm: Balanced informative content without creating unnecessary anxiety
Roadmap Priorities
- Enhanced AI Analysis: Improved mosquito breeding site identification
- Healthcare Integration: Partnership with medical institutions
- Global Expansion: Multi-language support and regional customization
- Wearable Integration: Symptom tracking through health devices
Potential Impact
- Support public health surveillance efforts
- Reduce Zika transmission through community awareness
- Contribute to medical research through crowdsourced data
- Improve health literacy in affected communities
Check other
Projects
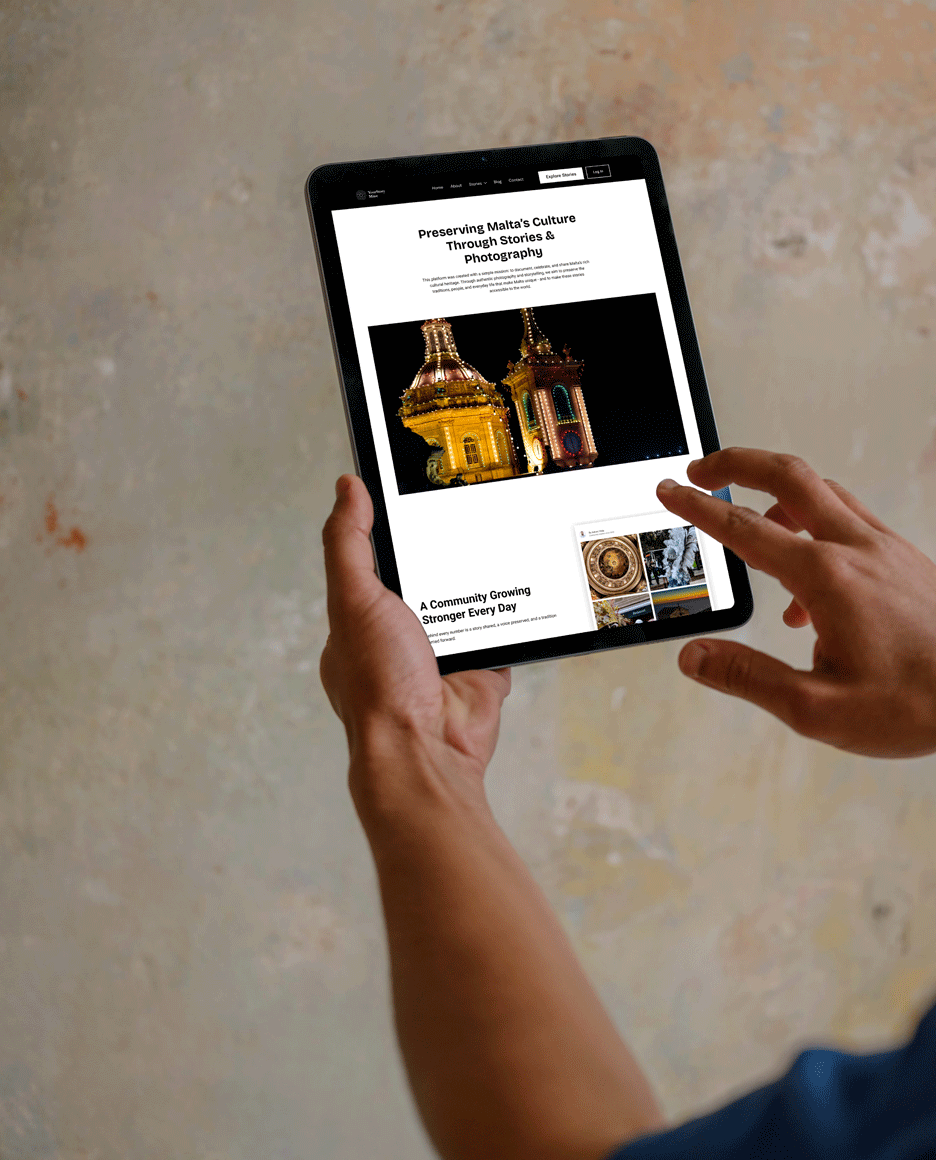

A digital storytelling platform that captures and promotes diverse perceptions of Maltese beauty through community-driven photographic narratives.
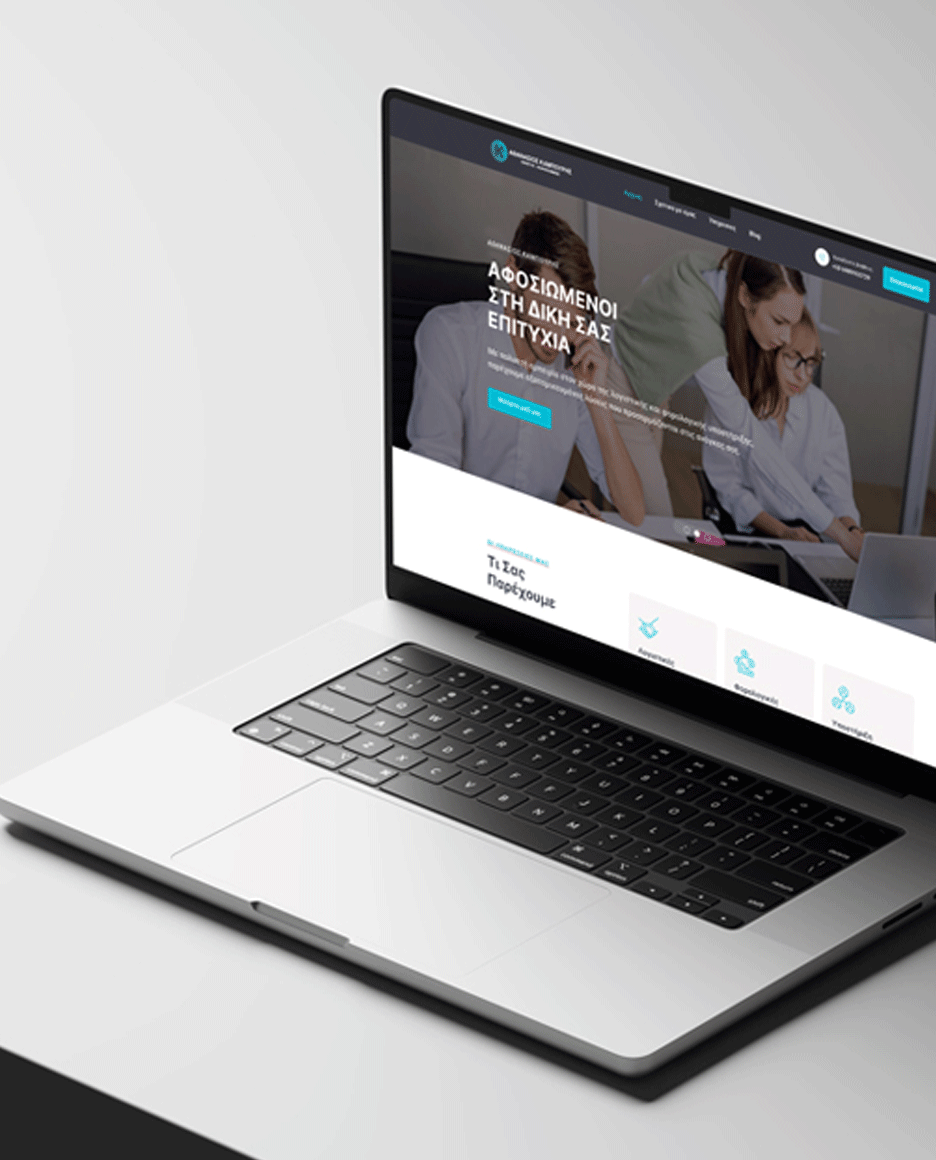
UX/UI design and development project for a professional accounting and tax services firm in Greece.